
We live submerged in an invisible ocean – the atmosphere. We check its temperature daily, dressing for the heat or cold. But temperature alone tells only part of the story. Why do windows sometimes weep with condensation, even indoors? Why does static electricity plague us in winter? Why does an 80°F day sometimes feel pleasantly warm, and other times unbearably sticky and oppressive? The answers lie hidden in the air itself, in the unseen presence of water vapor, and understanding it requires us to look beyond the simple thermometer. It involves delving into the science of humidity, dew point, and wet bulb temperature – concepts that profoundly shape our comfort, health, and the world around us. Fortunately, modern tools, exemplified by devices like the VLIKE 6508 Digital Temperature and Humidity Meter, empower us to pull back the curtain on this invisible world.

Unpacking Relative Humidity – The Air’s Thirst
Let’s start with the most familiar term after temperature: Relative Humidity (RH). Often expressed as a percentage, RH compares the actual amount of water vapor present in the air to the maximum amount the air could possibly hold at its current temperature. Think of the air as a giant, temperature-sensitive sponge. Warmer air can hold significantly more moisture than colder air – its “sponge capacity” increases. So, 50% RH means the air is holding half of the total water vapor it’s capable of holding at that specific temperature. Change the temperature without changing the moisture content, and the RH changes. Cool the air down, and its capacity shrinks; the same amount of water vapor now represents a higher percentage, increasing the RH.
But why does this percentage matter so intensely?
- Our Comfort Thermostat: Our bodies cool themselves primarily through sweating. Evaporation requires energy, drawing heat away from our skin. When RH is high, the air is already quite “full” of water vapor, slowing down evaporation. Sweat clings to us, making us feel hotter and clammy. Conversely, very low RH allows sweat to evaporate too quickly, potentially leading to dehydration and that dry, scratchy feeling in our skin and airways. General guidelines, often referenced by organizations like ASHRAE (American Society of Heating, Refrigerating and Air-Conditioning Engineers), suggest maintaining indoor RH roughly between 30% and 60% for optimal comfort and health, though specific needs vary.
- The Health Nexus: High humidity is a welcome mat for unwelcome guests. Mold and mildew thrive in damp conditions (generally above 60-70% RH), releasing spores that can trigger allergies and asthma, and potentially cause other respiratory problems. Dust mites, another common allergen, also flourish in higher humidity. Some studies even suggest that certain viruses, like influenza, may survive longer in very dry or very humid conditions compared to mid-range humidity levels. Low humidity, on the other hand, can dry out mucous membranes, potentially making us more susceptible to infections and causing nosebleeds or sore throats.
- The Material World’s Silent Struggle: Water vapor interacts constantly with materials. Wood, being hygroscopic (readily absorbing moisture), swells in high humidity and shrinks and cracks in low humidity – a nightmare for furniture, flooring, and especially musical instruments. Paper degrades faster, metals corrode more readily, and sensitive electronics can suffer from condensation or static discharge issues related to humidity extremes.
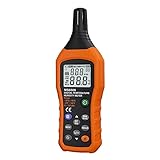
Quantifying this crucial variable is the first step beyond simple temperature readings. Instruments designed for this, known as hygrometers, are essential. Digital versions, like the VLIKE 6508, provide direct percentage readings. According to its product information, this device measures across the full spectrum from 0% to 100% RH. The stated accuracy is ±3.0% RH within the common indoor range of 20% to 80%, and ±4.0% RH at the more extreme ends (0% to 20% and 80% to 100%). Understanding these numbers allows us to objectively assess whether our environment falls within desired ranges.

Dew Point – Revealing the Air’s True Moisture Burden
While RH is useful, its dependence on temperature can sometimes be misleading. A cold winter day at 90% RH might actually contain less total water vapor than a warm summer day at 50% RH. To get a clearer picture of the actual amount of moisture in the air, independent of temperature, we turn to the Dew Point Temperature (DP).
Imagine cooling a parcel of air while keeping its moisture content constant. As the air cools, its capacity to hold water vapor decreases (the “sponge” shrinks). Eventually, it reaches a temperature where it becomes completely saturated – 100% RH. Any further cooling, or the introduction of more moisture, will force the excess water vapor to condense into liquid water. That saturation temperature is the dew point.
Think of a cold glass of iced tea on a summer day. The air immediately surrounding the cold glass surface cools rapidly. If it cools below its dew point temperature, the invisible water vapor in the air transforms into visible liquid water droplets on the outside of the glass – condensation. The dew point is literally the temperature at which “dew” starts to form.
Why is dew point such a powerful metric?
- True Moisture Indicator: Unlike RH, the dew point directly reflects the absolute amount of water vapor present. A higher dew point always means more moisture in the air, regardless of the current temperature. This makes it a better indicator of how “muggy” or “humid” the air actually feels to us. Many find that dew points above 65°F (about 18°C) start to feel uncomfortable, while those above 70°F (about 21°C) feel downright oppressive.
- The Condensation Forecaster: Dew point is the ultimate predictor of condensation. If any surface’s temperature drops below the surrounding air’s dew point, condensation will occur on that surface. This is critical for preventing moisture damage in homes and buildings. Knowing the indoor dew point helps identify risks on windows, cold water pipes, basement walls, inside electronic enclosures, or near poorly insulated areas.
Accessing this vital piece of information is a key feature of more advanced environmental meters. The VLIKE 6508, for instance, calculates and displays the dew point temperature based on its temperature and RH readings (the product information specifies a measurement capability within a -50°C to 60°C / -58°F to 140°F range). Monitoring the dew point allows for proactive measures – perhaps increasing ventilation, using a dehumidifier, or improving insulation – before dripping pipes or damp spots lead to mold and decay.

Wet Bulb Temperature – Nature’s Cooling Limit
There’s one more temperature measurement offered by sophisticated hygrometers that provides unique insight: Wet Bulb Temperature (WB). This one is a bit less intuitive but crucial for understanding cooling processes and heat stress.
Imagine a standard thermometer with its bulb covered by a wet piece of cloth (a wick). If you swing this thermometer through the air, water will evaporate from the wick. This evaporation process requires energy, which it draws from the thermometer bulb, thereby cooling it down. The temperature will drop until the air surrounding the wick becomes saturated with water vapor due to the evaporation, at which point net evaporation stops. The lowest temperature the thermometer reaches during this process is the wet bulb temperature.
It’s essentially a measure of how much cooling can be achieved through evaporation alone under the current atmospheric conditions.
* If the air is very dry (low RH), evaporation happens readily, leading to significant cooling, and the wet bulb temperature will be much lower than the actual air temperature (often called the “dry bulb” temperature in this context).
* If the air is very humid (high RH), evaporation is suppressed, less cooling occurs, and the wet bulb temperature will be very close to the dry bulb temperature. At 100% RH, the dry bulb, wet bulb, and dew point temperatures are all identical.
What’s the practical significance of Wet Bulb Temperature?
- Human Heat Stress: WB temperature is a key factor in calculating heat indices like the WBGT (Wet Bulb Globe Temperature), used to assess the risk of heatstroke for athletes, workers, and military personnel. High WB temperatures (approaching human skin temperature, around 95°F or 35°C, though effects are felt much lower) indicate conditions where the body’s primary cooling mechanism – sweating – becomes ineffective, making heat exhaustion and heatstroke much more likely.
- HVAC and Cooling Towers: Engineers use WB temperature to evaluate the performance and efficiency of air conditioning systems and industrial cooling towers, which rely on evaporative cooling principles.
- Agriculture: It helps assess potential heat stress on crops and livestock.
While perhaps less directly relevant for everyday home monitoring than RH or DP, the inclusion of Wet Bulb measurement capability on devices like the VLIKE 6508 (specifications state it measures Ambient and WB Temp from -20°C to 60°C / -4°F to 140°F) provides a more complete environmental picture, especially valuable for HVAC professionals, building scientists, or those in specific agricultural or industrial settings.
Peeking Under the Hood – How We Measure the Invisible
For centuries, humans have sought to quantify humidity. Early attempts were ingenious but imprecise – Leonardo da Vinci sketched ideas for hygrometers using absorbent materials like wool or hair, whose weight or length changes with moisture. Thankfully, technology has advanced dramatically.
Modern digital hygrometers rely on sophisticated electronic sensors. While various types exist, many common consumer devices use:
* Capacitive Sensors: These feature a small capacitor with a dielectric material between its plates that readily absorbs moisture from the air. As the moisture content changes, the dielectric constant changes, altering the capacitor’s ability to store charge (its capacitance). Electronics measure this change and correlate it to RH.
* Resistive Sensors: These utilize a material (often a polymer or ceramic) whose electrical resistance changes as it absorbs water vapor. By measuring the resistance, the device calculates the RH.
* Thermal Sensors: Temperature is typically measured using thermistors (resistors whose resistance changes predictably with temperature) or other semiconductor-based temperature sensors.
The VLIKE 6508 description mentions using a “High-Precision digital sensor (SHT11)”. The SHTxx series from Sensirion are well-known combined temperature and humidity sensors often used in various applications, integrating both sensing elements and signal processing on a single chip. The quality and calibration of the specific sensor implementation are key to a device’s accuracy.
But the sensor is only part of the equation. The instrument itself needs to process the raw signals and present the information usefully. This is where features listed for the VLIKE 6508 come into play:
* Clear Display: An LCD screen, ideally with a backlight for visibility in dim conditions, showing multiple readings (like temperature and humidity simultaneously – a “dual display”).
* Unit Flexibility: The ability to easily switch between Celsius and Fahrenheit (°C/°F) is essential for usability, especially in North America.
* Capturing the Moment: A Data Hold function freezes the current reading on the display, useful when taking measurements in awkward spots. MAX/MIN recording captures the highest and lowest values encountered since the function was activated, helpful for understanding the range of conditions over a period.
* Tracking Changes: Data Logging allows the device to store multiple readings over time (the source states up to 99 groups for the VLIKE 6508). This is invaluable for identifying patterns – does humidity spike after showering? How much does it fluctuate overnight? Does the HVAC system effectively control humidity swings? Downloading or reviewing this data provides much deeper insight than single spot checks.
* Practical Design: Portability, durable casing (ABS plastic mentioned), and some resistance to dust and splashes enhance usability in various environments. Battery power (4xAAA required per source) allows use anywhere.
It’s also important to touch upon calibration. Like many precision instruments, humidity sensors can experience “drift” over time due to contamination, aging, or exposure to harsh conditions. While factory calibrated (as stated for the VLIKE 6508), periodic recalibration against a known standard might be necessary for applications demanding sustained high accuracy, although the source suggests this is best left to professionals. For general home use, awareness that readings might slightly shift over years is usually sufficient.

Knowledge into Action – Mastering Your Microclimate
Understanding the science of T, RH, DP, and WB is fascinating, but the real power comes from applying this knowledge using data from a reliable instrument. Armed with readings from a device like the VLIKE 6508, you can transition from passively experiencing your environment to actively managing it:
- The Healthy Home Guardian: Is that musty smell in the basement really mold? Monitor RH and DP. If consistently high (e.g., RH > 60-70% or DP near the wall temperature), take action: improve ventilation, run a dehumidifier, check for leaks. Struggling with dry winter air? Use the RH reading to guide humidifier use, aiming for that comfortable 30-60% range to soothe airways without encouraging mold. Tracking MAX/MIN values can reveal problematic peaks and troughs.
- The Preservationist’s Ally: Protecting precious items requires stable conditions. For a wine cellar, maintaining specific temperature and humidity ranges is crucial. A cigar aficionado relies on precise RH (often around 70%) in their humidor. Musicians know the perils of letting valuable wooden instruments get too dry or too damp; monitoring RH and DP near storage areas allows for timely intervention (humidifiers, dehumidifiers, case adjustments). Libraries and archives use similar principles to preserve paper and bindings. Data logging can verify if conditions remain stable over days or weeks.
- The DIYer and Professional’s Edge: Planning to paint or varnish? Humidity significantly affects drying times and finish quality. Checking RH and DP ensures conditions are optimal. HVAC technicians use RH, DP, and WB readings extensively to diagnose system problems, assess efficiency (comparing air conditions before and after the coils), and ensure proper airflow and dehumidification are occurring. Building inspectors might use these readings to investigate moisture intrusion issues.
The user feedback mentioned in the source text (general satisfaction with performance, ease of use, and value, alongside some mixed views on accuracy and a note on battery life) highlights the practical considerations. An easy-to-read display, simple button functions (like switching modes or holding data), and portability contribute significantly to a device’s utility in these real-world scenarios. While pinpoint accuracy might be debated among users or vary between units, having a consistent tool to track changes and relative levels is often the most valuable aspect for non-laboratory use.
Conclusion – Decoding Your Environment
The air that surrounds us is a complex and dynamic entity, far richer than a single temperature reading can convey. By exploring the interconnected concepts of relative humidity, dew point, and wet bulb temperature, we gain a profound appreciation for the invisible forces shaping our comfort, health, and the integrity of the objects we value.
Understanding this science isn’t just academic; it’s empowering. Instruments like digital hygrometer thermometers – exemplified here by the features and stated capabilities of the VLIKE 6508 – serve as our translators, converting the silent signals of the atmosphere into actionable data. They allow us to move beyond guesswork, to diagnose problems, optimize conditions, and ultimately, become more conscious and effective stewards of our immediate microclimates. Whether you’re safeguarding your family’s health, preserving cherished belongings, or perfecting a craft, embracing the science of your environment, armed with curiosity and the right tools, opens the door to a healthier, more comfortable, and better-managed world.