
Imagine possessing a sixth sense, the ability to perceive a hidden dimension of reality that surrounds us constantly, yet remains invisible to our eyes. This isn’t science fiction; it’s the world of heat, a silent language spoken by every object, revealing stories of energy waste, potential failures, and the intricate dance of thermodynamics. For centuries, this thermal world lay beyond our direct perception. Then, science offered us a key, a way to unlock this invisible realm: infrared thermography.
Our journey into seeing heat arguably began by accident. In 1800, the astronomer Sir William Herschel was experimenting with prisms, splitting sunlight to measure the temperature of different colors. He noticed something peculiar: his thermometer registered the highest temperature beyond the red end of the visible spectrum, in an area where he could see no light at all. He had stumbled upon infrared radiation, the very energy that thermal cameras harness today.
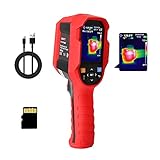
Modern tools, like the UNI-T UTi89 Pro Thermal Camera Imager, represent the culmination of efforts to translate this invisible energy into meaningful visual information, bringing the power of thermal vision out of specialized labs and into the hands of professionals and curious individuals alike. But to truly wield this power, we need to understand the science that makes it possible.
(Important Note: Specific details regarding the UNI-T UTi89 Pro’s specifications and performance mentioned in this article are primarily based on information available from its Amazon product listing (ASIN: B09NR915NR). While presented for illustrative purposes, readers are advised to consult official technical documentation from UNI-T for the most accurate and verified data.)

The Fundamental Science: How We ‘See’ with Heat
So, what exactly are we seeing when we look at a thermal image? Everything with a temperature above absolute zero (a frigid -273.15^\circ C or -459.67^\circ F) continuously emits energy in the form of electromagnetic waves. Much of this energy falls into the infrared (IR) part of the spectrum, wavelengths longer than visible red light. Our eyes aren’t equipped to detect this, but thermal imagers are.
At the heart of a thermal camera lies a sophisticated sensor, often an array of tiny detectors called microbolometers. Think of each microbolometer as a microscopic thermometer. When infrared radiation from the scene strikes these detectors, they absorb the energy and heat up ever so slightly. This change in temperature causes a measurable change in their electrical resistance. The camera’s internal electronics rapidly measure these changes across the entire array, pixel by pixel. Complex algorithms then process these electrical signals, translating the pattern of detected infrared energy into a visual image, often displayed using a range of colors – a thermogram. This image is essentially a heat map, where different colors correspond to different intensities of infrared radiation detected.
The Crucial Concept Often Overlooked: Emissivity
However, there’s a subtle but vital piece to this puzzle: emissivity. Not all surfaces radiate heat equally, even if they are at the same temperature. A dull, black surface is a near-perfect radiator (high emissivity, close to 1.0), while a shiny, reflective surface is a poor radiator (low emissivity, closer to 0). Think of it like different materials having different ‘loudness’ when ‘shouting’ their heat signature.
Why does this matter? Because a thermal camera measures the radiation it receives, not temperature directly. To estimate temperature accurately, the camera (or the user interpreting the image) needs to account for the emissivity of the surface being viewed. While many handheld imagers, potentially including models like the UTi89 Pro based on typical features in its class, might use a fixed average emissivity setting for simplicity, understanding this concept is crucial for anyone aiming for precise temperature readings. It explains why, for instance, a piece of electrical tape (high emissivity) on a shiny metal component (low emissivity) will appear much ‘hotter’ in the thermal image, even if both are the same temperature. Knowing this helps you interpret what you see more accurately, focusing on temperature differences and patterns, which are often more diagnostically valuable than absolute numbers in many applications.

Decoding the Device: What Do Those Numbers Really Tell Us?
Looking at the specifications listed for a device like the UTi89 Pro, we see numbers like “80×60 IR Resolution” and “≤150mK NETD”. These aren’t just abstract figures; they describe the fundamental capabilities of the imager’s ‘thermal eye’. Let’s translate them into practical understanding.
Pixel Power & Seeing the Detail (IR Resolution: 80×60)
Imagine looking at a digital photograph. The more pixels it has, the sharper the image, revealing finer details. It’s similar with thermal imaging. The “80×60” listed for the UTi89 Pro refers to the dimensions of its detector array, meaning it captures 4,800 individual points of infrared data in each frame.
What does this mean in practice? Each pixel represents an average temperature reading over a small area of the target scene. With 4,800 pixels, you gain the ability to distinguish relatively small thermal anomalies. Could you spot a single, slightly warm screw head on an electrical panel from a distance? Perhaps. Could you identify a narrow draft sneaking under a door? Likely. Compared to higher-end cameras with vastly more pixels, an 80×60 resolution is considered entry-level, but as the source text’s application examples suggest, it can provide sufficient detail for many common diagnostic tasks like basic home inspections, checking electrical boxes, or monitoring machinery components for significant hot spots. It’s about matching the tool’s capability to the scale of the problem you’re trying to see.
Sensing the Subtle Nuances (NETD: ≤150mK)
If resolution is about sharpness, Thermal Sensitivity, often expressed as NETD (Noise Equivalent Temperature Difference), is about fineness or subtlety. Think of it like having incredibly sensitive hearing that can pick up the faintest whisper in a quiet room. NETD, measured in milliKelvins (mK – thousandths of a degree Celsius), quantifies the smallest temperature difference the camera can reliably detect against its own internal electronic noise. A lower NETD number is better, indicating higher sensitivity.
The specification “≤150mK” suggests the UTi89 Pro can discern temperature variations down to approximately 0.15 degrees Celsius. Why is this important? Many problems manifest as subtle temperature changes initially. A slight coolness on a wall might indicate the very beginning of moisture intrusion due to evaporative cooling. A component running just a few degrees warmer than its neighbors could be an early sign of stress or impending failure. This level of sensitivity allows users to potentially catch problems earlier, before they become major issues. While achieving perfect accuracy in temperature measurement is complex (remember emissivity!), having good sensitivity is fundamental to simply seeing these crucial, subtle thermal differences. This capability directly relates to the diagnostic power of the instrument for tasks like finding air leaks or performing preventative maintenance checks.
Colorizing Heat: The Purpose of Palettes
Thermal cameras don’t actually see color in the infrared spectrum. The vibrant colors you see on the display (like the ‘Iron Oxide Red’, ‘Rainbow’, or ‘White Heat’ palettes mentioned for the UTi89 Pro) are artificial representations – pseudo-color. They are visualization tools designed to make interpreting the temperature data easier for the human eye.
Think of them as different filters or modes on a map. A high-contrast palette like ‘White Heat’ (where hotter areas are bright white) might be excellent for quickly spotting the absolute hottest point in a scene, useful for identifying an overheating component. A ‘Rainbow’ palette, with its broader range of colors, might be better for visualizing gradual temperature changes across a surface, like mapping the heat distribution on a wall to understand insulation effectiveness. Choosing the right palette depends on the task at hand; they are analytical aids helping you translate the raw thermal data into actionable understanding.
Other Key Factors Briefly Considered
The listed Temperature Range (-10°C to 400°C / 14°F to 752°F) speaks to the device’s versatility, enabling checks from frosty refrigeration coils to moderately hot mechanical parts, as outlined in the source’s application list. The 9Hz Refresh Rate is quite standard for thermal imagers in this accessible category, partly due to international export regulations. While faster rates exist (offering smoother viewing of moving targets), 9Hz is generally adequate for scanning stationary objects or slowly changing thermal scenes, which covers a vast majority of typical inspection tasks.
Putting Science to Work: Real-World Applications
The true value of this technology emerges when we apply it to solve real-world problems. Based on the applications described in the source material, the UTi89 Pro, powered by these scientific principles, becomes a versatile diagnostic tool:
- The Home Detective: Imagine scanning your walls in winter. Those cool blue streaks near windows or ceilings? Likely air leaks or missing insulation, pinpointed instantly. That slightly cooler patch on the floor near the dishwasher? Could be an early sign of a hidden water leak. Thermal vision empowers homeowners to conduct their own energy audits and spot potential moisture issues before they cause significant damage.
- The Safety Inspector: For electricians or maintenance professionals, a quick scan of an electrical panel can reveal hidden dangers. A breaker or wire connection glowing significantly hotter than others is a clear red flag, indicating a potential overload or poor connection – a fire hazard waiting to happen. Thermal imaging allows for non-contact inspection, enhancing safety.
- The Mechanical Whisperer: Pointing the imager at a running motor, pump, or bearing can reveal abnormal heat patterns. Excessive heat often indicates friction, misalignment, lubrication issues, or impending failure. This allows for preventative maintenance, scheduling repairs before a critical breakdown occurs.
Built for the Task? Practical Considerations
Beyond the core imaging science, practical usability matters. The product description lists an IP65 rating, which, according to international standards, suggests the device is dust-tight and protected against water jets from any direction. A claimed 2-meter drop durability further implies resilience needed for fieldwork or busy workshop environments. Features like the 16GB SD card for saving images are crucial for documentation and creating reports. The USB-C connectivity for charging and potentially connecting to PC software (as mentioned) extends the tool’s utility, allowing for more detailed image analysis, temperature measurements on specific points or areas (Region of Interest – ROI), and tracking temperature trends over time – transforming the imager from just a viewing device into a data-gathering tool.

Conclusion: Empowered by Thermal Vision
The journey from Herschel’s curious thermometer reading to handheld devices capable of revealing the intricate thermal tapestry around us is a testament to scientific ingenuity. Infrared thermography offers a unique window into a world otherwise hidden, providing insights that can save energy, prevent failures, enhance safety, and deepen our understanding of how things work.
Tools like the UNI-T UTi89 Pro, based on its described features, aim to democratize this powerful capability. But owning the tool is only the first step. True empowerment comes from understanding the science behind the image – knowing what resolution implies for detail, what sensitivity allows you to detect, why emissivity affects readings, and how different palettes aid interpretation. By grasping these fundamentals, users can move beyond simply looking at colorful pictures to truly interpreting the thermal stories being told, making informed decisions, and proactively addressing issues unveiled by this fascinating ‘sixth sense’ that science has provided. The quest to see and understand continues, and thermal vision is a remarkable part of that journey.