Ever walk across the carpet on a dry winter day and get that surprising zap from a doorknob? Or descend into a basement that feels inexplicably damp and chilly, even when the rest of the house is fine? Perhaps you’ve found yourself constantly adjusting the thermostat in a baby’s room, striving for that elusive “just right” feeling. These everyday experiences are dictated by invisible forces shaping our indoor world: temperature and humidity. Like unseen roommates, they constantly influence our comfort, health, and even the condition of our homes. Understanding and managing this indoor climate isn’t just about luxury; it’s about creating a healthier, more comfortable, and potentially more energy-efficient living space. And thankfully, we no longer have to guess – simple tools can help us “see” and understand these crucial environmental factors.

A Brief History of Seeing the Unseen
For centuries, humanity has sought to quantify the world around us. Measuring temperature took significant leaps with minds like Galileo Galilei, whose early thermoscope paved the way, and later Daniel Gabriel Fahrenheit and Anders Celsius, who gave us the scales we use today. Grasping humidity, the amount of moisture held in the air, proved trickier. Early concepts existed – Leonardo da Vinci sketched a hygrometer using absorbent wool – but systematic measurement developed later. This long journey reflects our innate desire to move from subjective feelings (“it feels cold,” “the air feels damp”) to objective understanding. Today, digital technology puts sophisticated environmental sensing capabilities, once the domain of laboratories, right into our homes.
Decoding the Air We Breathe: Temperature & Humidity Fundamentals
Let’s break down these two key players:
Temperature: At its core, temperature is a measure of the average kinetic energy – the movement – of molecules within the air. For us, it translates directly to sensations of warmth or cold as our bodies exchange heat with our surroundings. Maintaining a stable internal body temperature is vital, so the air temperature around us plays a massive role in our physiological comfort.
Relative Humidity (RH): This one can be a bit more slippery. Imagine the air around you is like a giant, invisible sponge. Its ability to soak up water vapor isn’t fixed; it depends heavily on the temperature. Warmer air can hold significantly more moisture than colder air. Relative Humidity (RH) tells us how “full” this air sponge currently is, expressed as a percentage of its maximum water-holding capacity at its current temperature. So, 50% RH means the air is holding half the water vapor it possibly could at that specific temperature. This is why cold winter air, even if it holds the same absolute amount of water vapor as warmer air, feels much drier – its RH plummets when heated indoors because its capacity to hold moisture increases dramatically.
The Double-Edged Sword: When Humidity Goes Wrong
Like many things in nature, humidity is all about balance. Extremes in either direction can cause problems:
- Too Dry (Generally <40% RH): Welcome to the land of static electricity, itchy skin, dry nasal passages, and maybe even a scratchy throat. Wood furniture and floors can lose moisture and shrink or crack. Viruses may also spread more easily in overly dry air. It’s that feeling of crispness turned uncomfortable.
- Too Wet (Generally >70% RH): This is the realm of stickiness and stuffiness. High humidity makes it harder for our sweat to evaporate, hindering our natural cooling mechanism. Worse, it creates a welcoming environment for unwelcome guests: mold, mildew, and dust mites thrive in damp conditions, potentially triggering allergies, asthma, and other respiratory issues. Condensation on windows or walls can be a tell-tale sign.
Finding Your Indoor Sweet Spot: The Science of Comfort
So, what’s the ideal range? While individual preferences vary slightly, scientific research and building standards (like those suggested by organizations such as ASHRAE – the American Society of Heating, Refrigerating and Air-Conditioning Engineers) generally point towards an indoor Relative Humidity between 40% and 60% (sometimes up to 70%) as being optimal for human comfort and health, and for preserving the integrity of building materials and furnishings. This “comfort zone” represents a balance – moist enough to avoid dryness issues, but dry enough to discourage mold and mite growth.
Why Fly Blind? The Case for Monitoring Your Indoor Climate
Relying solely on how we feel to gauge temperature and humidity can be misleading. Our perception is influenced by factors like activity level, clothing, and even recent exposure to different conditions. Monitoring provides objective data, offering several key advantages:
- Moving from Guesswork to Insight: Get actual numbers instead of vague feelings.
- Early Problem Detection: Spot trends like rising humidity in the basement before mold becomes visible, or identify extreme temperature swings in sensitive areas.
- Optimizing Comfort: Fine-tune heating, cooling, humidification, or dehumidification based on real data, not assumptions.
- Potential Energy Savings: Maintaining optimal humidity can make you feel comfortable at slightly higher (in summer) or lower (in winter) thermostat settings, potentially saving energy. For instance, humid air can feel warmer, potentially allowing a lower thermostat setting in winter.
- Empowering Informed Action: Know when and why you might need to ventilate a room, run a dehumidifier, or add moisture to the air.
Tools of the Trade: Introducing the Digital Hygrometer Thermometer
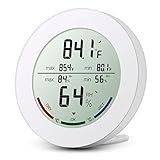
This is where devices like the ORIA WA21W-O52118-OUS Indoor Hygrometer Thermometer come into play. Based on its product description, it serves as a straightforward example of modern digital instruments designed to give you a clear window into your room’s climate. These tools typically combine sensors for both temperature and humidity, presenting the information conveniently on a digital display.
Unpacking the Features: More Than Meets the Eye
Let’s delve deeper into the significance of the features commonly found on such devices, using the ORIA WA21W’s described capabilities as reference points:
The Clear Display: Instant Awareness
The most obvious feature is the screen – the product description mentions a 2.5-inch LCD for the ORIA WA21W. In the evolution from older analog dials with physical needles (which could be prone to parallax error or require closer inspection), digital displays offer immediate, unambiguous readings.
* Scientific Principle: Clear and accessible data presentation is fundamental for effective monitoring. Reducing ambiguity minimizes misinterpretation.
* User Value: Effortless reading, even from a distance or with a quick glance, makes monitoring convenient rather than a chore. It’s easily understood by anyone in the household.
* Scenario: Imagine quickly checking the living room conditions while prepping dinner, or easily reading the temperature in a child’s room without needing to get too close and potentially disturb them.
Max/Min Records: Your Climate’s Diary
This might seem like a simple function, but recording the maximum and minimum temperature and humidity levels reached since the last reset is incredibly powerful.
* Scientific Principle: Our indoor environment isn’t static; it fluctuates throughout the day and night due to factors like outdoor conditions, sunlight, occupancy, and HVAC cycling. Max/Min records capture the range of these fluctuations, revealing patterns hidden from simple spot checks. It helps understand thermal inertia (how quickly a space heats up or cools down) and the effectiveness of climate control systems.
* User Value: This feature acts like a diagnostic tool. Are humidity levels spiking overnight in the bedroom, potentially contributing to morning congestion? Is the attic overheating drastically during sunny afternoons? Does the temperature drop significantly near windows on cold nights, indicating poor insulation? Max/Min helps uncover these transient but important events without requiring constant vigilance.
* Scenario: Checking the Max/Min readings in a basement after a rainy period could reveal if humidity peaked at problematic levels, even if it feels okay now. Monitoring a baby’s room overnight ensures the temperature remained within a safe and comfortable band.
Comfort Level Indicators (DRY/OK/WET): Science Simplified
Many digital hygrometers, including the ORIA WA21W as described, offer visual indicators based on humidity ranges (e.g., DRY <40%, OK 40-70%, WET >70%).
* Scientific Principle: These indicators apply generally accepted thresholds, derived from comfort and health research (like the ASHRAE guidelines), directly to the measured Relative Humidity. They effectively translate the numerical data point into a quick assessment of the potential environmental implications. <40% RH correlates with increased static and dryness; >70% RH increases the risk of mold and dust mite proliferation.
* User Value: For those not wanting to memorize specific RH percentages, these indicators provide immediate, intuitive context. “OK” offers reassurance, while “DRY” or “WET” acts as a clear prompt to consider action (e.g., using a humidifier or dehumidifier, checking for moisture sources).
* Scenario: Seeing the indicator consistently read “DRY” during winter might finally convince you that the dry skin and static shocks aren’t just imagination, prompting the use of a humidifier. A persistent “WET” reading in a bathroom, even hours after showering, signals a need for better ventilation.
°C/°F Button: Speaking Your Language
The ability to switch between Celsius and Fahrenheit is a simple matter of user preference and accommodating different measurement standards (Fahrenheit being common in the US, Celsius used in science and most other parts of the world). It ensures the device is easily understandable regardless of the user’s preferred scale.
Getting the Best Reading: Placement Matters
Where you place your hygrometer thermometer significantly impacts the readings. You want data that’s representative of the room’s general conditions.
* The Science of Sampling: Avoid placing the unit in direct sunlight (which heats the sensor), near heating/cooling vents (which show localized extremes), or close to obvious moisture sources (like showers or boiling kettles). Ideally, place it in a location with good air circulation, away from exterior walls if possible, around breathing height for human comfort assessment. The ORIA WA21W’s described options for wall mounting or using a stand offer flexibility here.
Reading Between the Lines: Interpreting the Data
A single reading is just a snapshot. The real value comes from observing patterns over time. Look at the interplay between temperature and humidity. Note the Max/Min values and how wide the swings are. Use the comfort indicator for quick context. Does the humidity drop drastically when the heating kicks on? Does it climb slowly after cooking or showering? Understanding these dynamics is key to effectively managing your indoor climate.
Conclusion: Knowledge is Comfort (and Health)
Our homes are our sanctuaries, yet they possess an invisible climate that profoundly impacts how we feel and function. By making the unseen visible, simple tools like indoor hygrometer thermometers – exemplified by devices like the ORIA WA21W based on its described features – empower us. Monitoring temperature and humidity isn’t about obsessing over numbers; it’s about gaining understanding. This knowledge allows us to move beyond guesswork, take informed steps towards creating a more comfortable, healthier, and potentially more energy-efficient indoor environment, and perhaps even sparks a little curiosity about the fascinating science that governs our everyday surroundings. Taking control of your indoor climate starts with knowing what it truly is.