
It began, as many discoveries do, almost by accident. In the year 1800, the astronomer Sir William Herschel was experimenting with sunlight and prisms, measuring the temperatures of different colors of light. Curious, he placed a thermometer beyond the red end of the visible spectrum, where no light was apparent. To his surprise, the temperature reading climbed higher than in any visible color. He had stumbled upon an invisible force, a form of light energy emanating heat – what we now call infrared radiation. Herschel had unknowingly opened a window onto a hidden dimension, a universe teeming with thermal information that surrounds us constantly, yet remains utterly invisible to our eyes.
Fast forward over two centuries, and Herschel’s laboratory curiosity has blossomed into the powerful field of thermography, the science of capturing and interpreting these invisible heat signatures. We now understand that everything with a temperature above the theoretical coldest point, absolute zero (-273.15°C or -459.67°F), radiates infrared energy. It’s a fundamental language of the universe, telling stories of energy transfer, material states, and operational conditions. But how do we decipher this silent language? This is where tools like the Hti-Xintai HT-18 Thermal Imager come into play, acting as our translators, converting the unseen whispers of heat into images we can comprehend.
The Physics of Thermal Light: How We See Heat
To understand how a thermal imager works, picture the familiar electromagnetic spectrum, which ranges from radio waves through visible light to gamma rays. Infrared radiation sits just beyond the red light our eyes can detect, occupying a significant portion of this spectrum. The heat you feel radiating from a warm stovetop, the gentle warmth of the sun on your skin, even the heat signature of your own body – these are all forms of infrared energy traveling as electromagnetic waves.
The core principle is elegantly described by physics (often related through concepts like Planck’s Law of blackbody radiation): the amount and characteristic wavelength of the infrared energy an object emits are directly related to its temperature. Hotter objects don’t just radiate more energy; the peak wavelength of their radiation shifts. Thermal cameras are sophisticated instruments designed to detect these subtle differences in infrared energy across a scene.
Inside a modern thermal imager like the HT-18 lies an array of incredibly sensitive microscopic detectors, often referred to as a microbolometer focal plane array. Think of it as a grid of thousands of tiny thermometers. Each detector element absorbs incoming infrared radiation, which causes its temperature to change slightly. This change is then converted into an electrical signal. The camera’s processor takes the signals from every detector in the array, creating a detailed map of the temperature differences across its field of view. This raw temperature map is then processed and displayed as a visual image – a thermogram.
Crucially, because these detectors are measuring minute temperature changes, they need periodic recalibration to ensure accuracy and a uniform response across the array. This process, known as Non-Uniformity Correction (NUC), often involves the camera briefly placing a uniform temperature shutter in front of the sensor. This recalibration might be the source of the faint ‘clicking’ sound sometimes noticed by users of thermal cameras – it’s typically a sign the instrument is maintaining its measurement integrity.
Decoding the Heat Map: Resolution – The Sharpness of Thermal Sight
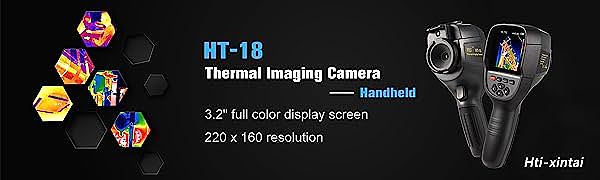
The first thing that strikes you about a thermogram is the image itself. Its clarity, its ability to show fine detail, is paramount for useful analysis, and this hinges on the camera’s Infrared (IR) Resolution. The Hti-Xintai HT-18, according to the provided information, features an IR resolution of 220 x 160 pixels. This means its sensor array is composed of 220 columns and 160 rows of detectors, totaling 35,200 individual measurement points.
Why does this number matter so much? Imagine creating a mosaic artwork. The more individual tiles (pixels) you have, the finer the details you can depict, the smoother the curves, and the more lifelike the overall picture. Similarly, in thermal imaging, higher resolution means the camera can distinguish smaller temperature differences between smaller areas. It allows you to move from seeing a vague ‘hot area’ to pinpointing an overheating wire within a complex circuit board, or identifying a narrow gap in insulation rather than just a generally cool wall.
While higher resolution is always desirable for capturing more detail, it also comes with increased sensor complexity and cost. The 220×160 resolution offered by the HT-18 represents a significant step up from lower-resolution entry-level imagers, providing a level of detail suitable for many diagnostic tasks in fields like home inspection, electrical maintenance, and basic mechanical checks, striking a balance between capability and accessibility. It allows users to capture a reasonably detailed thermal ‘painting’ of the scene, revealing patterns invisible to the naked eye.
Translating Temperature: The Art and Science of Color Palettes
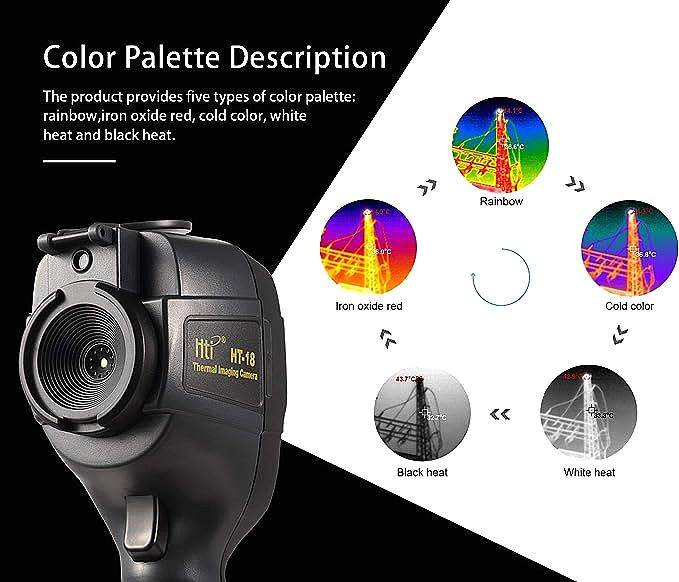
Once the camera captures the thermal data, it needs a way to present this invisible information to our very visible-light-oriented brains. Since infrared radiation has no inherent color we can perceive, thermal imagers use ‘false color’ palettes. These are essentially visual codes, algorithms that assign specific colors or shades of gray to different detected temperature ranges within the image.
The HT-18 provides five distinct palettes, as listed in its description: Rainbow, Iron Red, Cold Color, Black and White, and White and Black. Think of these palettes as different ‘translation keys’ for the language of heat.
- High-Contrast Palettes (like Rainbow, Iron Red): These often use a wide range of vibrant colors to represent the full temperature span in the scene. They excel at quickly highlighting the hottest and coldest spots and making significant temperature differences immediately obvious. They are great for initial scans and identifying areas of interest.
- Grayscale Palettes (Black & White, White & Black): These map temperatures to shades of gray. While less dramatic, they can sometimes reveal finer textural details or subtle temperature gradients that might be obscured by bold colors. They can be preferred for detailed analysis or when documenting findings in reports where color printing might be an issue.
- Specialized Palettes (like Cold Color): These might use specific color gradients (e.g., emphasizing blues and purples for colder areas) tailored for particular applications, like finding water leaks or insulation deficiencies.
The choice of palette isn’t just aesthetic; it’s a crucial part of the interpretation process. An experienced user will often switch between palettes to view the same scene from different perspectives, ensuring no critical thermal pattern is missed.
A common characteristic of many thermal imagers, especially in more accessible ranges, is auto-ranging behavior tied to these palettes. The camera intelligently analyzes the minimum and maximum temperatures currently in its view and automatically adjusts the temperature scale that is mapped across the chosen color palette. This is done to maximize the visual contrast within that specific scene, making thermal differences pop. However, as noted by some users in the provided source material’s review section, this dynamic adjustment means that the color representing a specific temperature can change if you pan the camera to include a much hotter or colder object. While excellent for maximizing contrast in a static view, it can make direct visual comparison between slightly different scenes (or tracking a specific temperature across views) more challenging. This is an inherent aspect of auto-adjusting systems designed for ease of use, and understanding this behavior is key to correct interpretation. More advanced applications sometimes benefit from manual range controls, which lock the temperature-to-color mapping.
Bridging Dimensions: The Power of Fused Imagery
Seeing a thermal pattern is one thing; knowing precisely where that pattern exists on the physical object is another. A hot spot on a thermogram doesn’t tell you if it’s a faulty wire, a reflection, or something else entirely without context. This is where the HT-18’s image blending capability, described in the source as an adjustable overlay, becomes invaluable.
This feature typically utilizes a second, standard visible-light camera built into the imager. The device captures both a thermal image and a regular photograph simultaneously. It then allows the user to fuse or overlay these two images on the display. Think of it as a primitive form of augmented reality: the invisible thermal data is layered directly onto the visible scene. The degree of blending can often be adjusted, from showing mostly the visible image with thermal highlights to a full thermal view with visible outlines.
The scientific challenge here lies in accurately aligning the two images (a process known as image registration), ensuring the thermal ‘hot spot’ perfectly lines up with the corresponding component in the visible image. When done well, this fusion provides immediate, unambiguous context. You don’t just see heat; you see the specific component radiating that heat. This is crucial for creating actionable reports, communicating findings clearly, and avoiding misdiagnosis. It transforms the thermogram from an abstract heat map into a pinpoint diagnostic tool.
Thermal Vision in Action: Decoding Real-World Scenarios
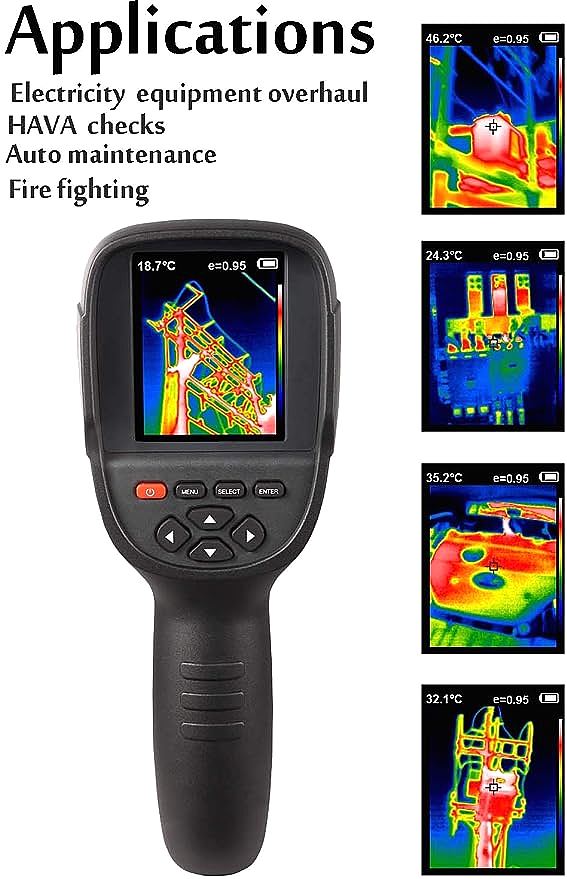
The true power of the HT-18, and thermal imaging in general, lies in its application to real-world problems. Armed with an understanding of resolution, palettes, and image fusion, let’s explore some scenarios based on the applications mentioned in the product information:
- The Energy-Wasting Home: Imagine scanning interior walls on a cold day. With the HT-18, the ghostly, dark tendrils of cold air infiltrating around a poorly sealed window frame become starkly visible against the warmer wall surface (perhaps using the ‘Cold Color’ palette). Pan across the ceiling, and a patchy, uneven ‘quilt’ of varying temperatures reveals areas where insulation has settled or was improperly installed – heat literally leaking out of the living space. The 220×160 resolution helps distinguish these patterns from minor surface variations.
- The Overheating Electrical Panel: Safety is paramount with electricity. Pointing the HT-18 at a breaker box (from a safe distance, of course!), one breaker might ‘glow’ significantly brighter in an ‘Iron Red’ palette than its identical neighbors. This isn’t normal; it’s a clear sign of excessive resistance and dangerous overheating, potentially averting a fire. The blending feature would confirm exactly which breaker is the culprit.
- The Hidden Plumbing Leak: A faint, cool ‘stain’ appearing on a thermogram of a ceiling or wall, especially in a ‘Black and White’ palette which emphasizes subtle gradients, could be the first sign of a slow water leak happening behind the surface. Water evaporation causes cooling, a signature the HT-18 can detect long before visible water damage appears. Similarly, tracing the ‘hot trail’ of a radiant heating pipe under the floor becomes simple, allowing checks for consistency or blockages.
- The Stressed Machine: In a workshop, monitoring machinery is key to predictive maintenance. A bearing on a motor might appear as a distinct, localized ‘hot spot’ compared to the rest of the housing, indicating friction and impending failure. Catching this early, thanks to the thermal view, allows for repair before a costly breakdown occurs.
In each case, the thermal imager isn’t just showing temperature; it’s revealing anomalies and patterns indicative of underlying issues – energy loss, potential hazards, hidden failures.
The Imager in Hand: Practical Considerations
A diagnostic tool is only as good as its usability in the field. The Hti-Xintai HT-18 incorporates several features, mentioned in the source description, aimed at practical workflow:
- Clear Viewing: The 3.2-inch color display provides the immediate visual interface for interpreting the thermograms and blended images on the spot.
- On-Board Recording: The inclusion of 3 GB of built-in memory is significant. It allows the user to capture and save thermal images directly on the device without needing a separate SD card or immediate connection to another device – essential for documenting findings during an inspection.
- Data Transfer: Saved images can later be transferred to a computer via the USB connection for further analysis, inclusion in reports, or archiving.
- Ergonomics: The handheld “gun” style design is common for thermal imagers, offering a generally comfortable and stable grip for pointing and capturing images. Its listed weight of 0.83 pounds contributes to its portability for fieldwork.
- Completeness: The inclusion of accessories like the USB cable, charger, travel pouch, lanyard, and even a drop resistance bag suggests a package designed for immediate use and protection in working environments.
- Non-Contact Measurement: Implicit in its function, the non-contact nature allows users to assess temperatures from a safe distance, crucial when dealing with high-voltage electrical components, moving machinery, or hard-to-reach areas.
These practical design elements work in concert with the core imaging technology to make the HT-18 a functional tool for gathering thermal data efficiently.
Conclusion: Empowered by Infrared Sight
From Sir William Herschel’s serendipitous discovery with prisms and thermometers to sophisticated handheld devices like the Hti-Xintai HT-18, our ability to perceive and interpret the infrared world has evolved dramatically. Thermal imaging technology pulls back a curtain on the invisible, revealing the dynamic tapestry of heat that underlies so much of our physical environment and technological infrastructure.
It transforms abstract temperature data into compelling visual evidence, highlighting inefficiencies, predicting failures, and enhancing safety. Understanding the science behind the image – the significance of resolution in capturing detail, the role of palettes in translating data for our eyes, the power of blending thermal and visible light for context – allows users to move beyond simply seeing heat to truly understanding its implications.
While reliant on the provided product information for its specific features, the Hti-Xintai HT-18 represents the increasing accessibility of this powerful perspective. Tools like these empower professionals and enthusiasts alike to diagnose problems, optimize systems, and make informed decisions based on a deeper understanding of the thermal world. The journey into infrared sight is a continuous exploration, and with each advancement, we become better equipped to read the subtle, silent, yet crucial language of heat.