Imagine stepping into a world painted not with visible light, but with the subtle glow of heat itself. Picture the walls of your home not just as solid surfaces, but as complex tapestries revealing hidden drafts or the warmth of buried pipes. See your car’s engine not just as metal, but as a dynamic landscape of varying temperatures indicating its operational health. This isn’t science fiction; it’s the reality revealed by thermal imaging, a technology that grants us a form of “heat vision,” extending our senses into a realm normally hidden from us. While our eyes are finely tuned to detect visible light, they are blind to the vast majority of energy radiating around us, particularly the energy we perceive as heat – infrared radiation. Tools like the HURRICANE Thermal Imaging Camera serve as our interpreters, translating this invisible language of heat into images we can see and understand, unlocking powerful diagnostic capabilities along the way.

The Language of Heat: Understanding Infrared Radiation
To grasp how thermal imaging works, we first need to understand what it’s “seeing.” Everything in the universe with a temperature above absolute zero (-459.67°F or -273.15°C) constantly emits energy. Much of this energy travels outwards as electromagnetic waves, similar to visible light, radio waves, or X-rays, but with different wavelengths. The portion of this spectrum associated with heat is called infrared (IR) radiation. You’ve felt it as the warmth radiating from a sun-baked pavement or a hot stovetop.
Crucially, the characteristics of this emitted IR radiation – specifically its intensity and peak wavelength – are directly related to an object’s temperature. Hotter objects generally radiate more intense infrared energy, and at shorter wavelengths, than cooler objects. This fundamental principle of physics means that the invisible infrared energy streaming from every surface carries detailed information about its temperature. It’s a silent broadcast, a heat signature, waiting to be decoded. Thermal imaging technology is designed precisely to capture and interpret this broadcast, non-invasively reading temperature from a distance.

Capturing the Invisible: How a Thermal Camera Works
Think of a thermal camera as a specialized digital camera, but instead of a sensor designed for visible light, it possesses a unique “eye” – typically an array of microscopic detectors often called a focal plane array (FPA) or sensor – sensitive to infrared radiation. When you point a thermal imager like the HURRICANE device at a scene, its lens focuses the incoming infrared radiation onto this sensor.
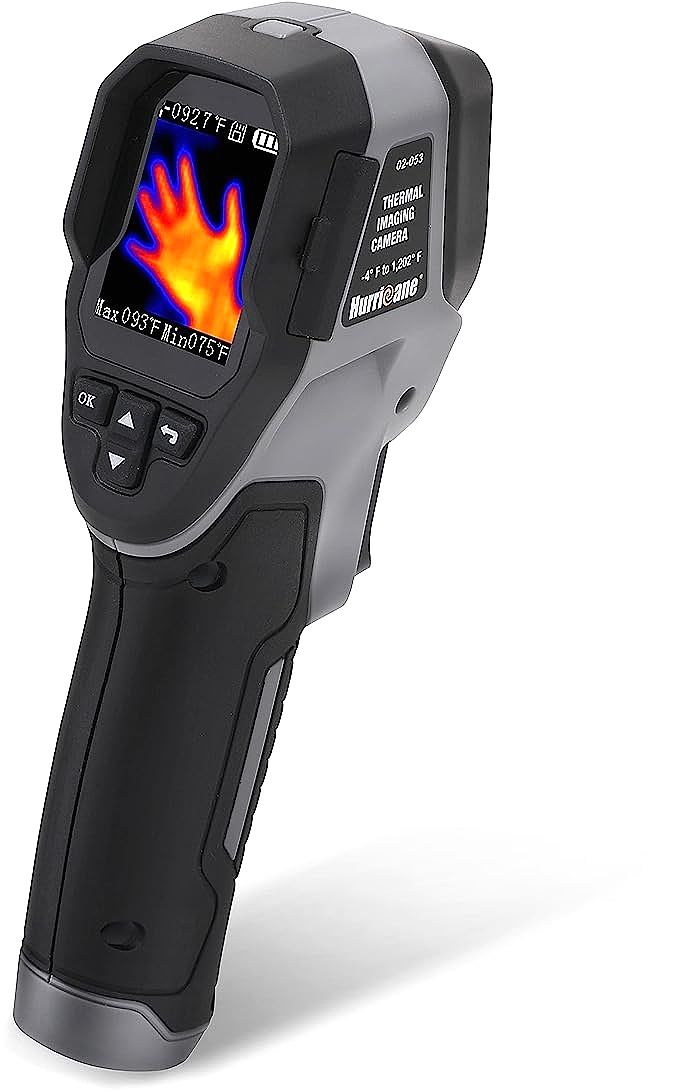
Each tiny detector element in the sensor array absorbs the IR energy striking it and heats up slightly. This change in temperature causes a measurable change in an electrical property (like resistance). The camera’s internal electronics rapidly measure these changes across the entire array, effectively creating a grid of temperature readings. This raw thermal data is then processed and converted into electronic signals that correspond to the temperature distribution across the scene. Finally, this information is sent to the display – in the case of the HURRICANE camera, a 1.8-inch full-color LCD screen – where the temperature data is visualized as an image, a thermogram, revealing the thermal landscape in front of you.
Decoding the Thermal Tapestry: Resolution and the Heat Mosaic
The level of detail in this thermogram depends heavily on the camera’s infrared resolution. The HURRICANE Thermal Imaging Camera is specified with an IR resolution of 1024 pixels, arranged in a 33×33 grid. What does this mean in practice? Imagine creating a picture using mosaic tiles. Each pixel in a thermal image is like one of those tiles, representing the average temperature measured over a specific area of the scene it corresponds to.
With 1024 pixels, the camera builds its thermal image from a 33-tile by 33-tile grid. A higher resolution (more pixels) would mean smaller tiles, allowing for finer details and sharper definition of temperature boundaries. A lower resolution, like 1024 pixels, results in a more “blocky” or mosaic-like image. While this resolution might not capture intricate details on small or distant objects, it is often sufficient for its primary purpose: quickly and clearly identifying significant temperature differences – hot spots or cold spots – that stand out from their surroundings. It allows you to see the broad strokes of the thermal landscape, pinpointing areas of interest that might warrant closer investigation. The 1.8″ color screen serves as the window through which you view this thermal mosaic in real-time.

Painting with Temperature: The Power of Color Palettes
Raw thermal data is just numbers. To make it instantly understandable to the human eye, thermal cameras translate these temperature readings into colors or shades of gray using different color palettes. Our visual system is exceptionally good at distinguishing between colors, often much better than discerning subtle shades of gray. Palettes leverage this by assigning specific colors to different temperature ranges, dramatically enhancing contrast and making thermal patterns pop.
The HURRICANE imager offers three common palettes, according to its description:
* Rainbow: Often uses the full spectrum of colors, mapping the coldest temperatures to blues/purples and the hottest to reds/yellows/whites. This provides high contrast across the entire temperature range, making variations very obvious.
* Iron Oxide Red: Typically uses a scale from black/purple through reds and oranges to yellow/white for hotter areas. This palette is often favored for industrial inspections as it provides strong contrast, particularly for highlighting hot spots against cooler backgrounds.
* Black and White (or White Heat / Black Heat): These are grayscale palettes where hotter temperatures are represented as white (White Hot) or black (Black Hot), with cooler temperatures shown in the opposite shade. This can be useful for reducing visual clutter, focusing on extreme temperatures, or when color might be distracting.
Think of palettes like applying different colored filters to a black and white photograph – each filter emphasizes different aspects of the underlying data. Selecting the appropriate palette is a key skill in thermography; the choice depends on the specific scene, the temperature differences you’re looking for, and personal preference for visual clarity. It’s a tool to optimize the way the thermal data is presented to your brain.
Quantifying the Glow: Measuring Temperature Across Extremes
Beyond just visualizing heat patterns, thermal imagers are measurement tools. A crucial specification is the temperature measurement range. The HURRICANE camera is listed with a remarkably wide range: from -4°F up to 1202°F (-20°C to 650°C). This breadth is significant because it allows the device to be potentially applied to an incredibly diverse set of scenarios. The lower end (-4°F) is suitable for detecting freezing conditions, finding cold air infiltration in buildings, or checking refrigeration systems. The upper end (1202°F) reaches temperatures relevant to inspecting components in high-heat environments, such as automotive exhaust systems, industrial machinery, or certain electrical connections under heavy load.
Accuracy is, of course, paramount for any measurement device. The product description specifies the accuracy as ±2% (as tested at 25°C) and lists “High Accuracy” as a special feature. This stated specification gives an indication of the instrument’s expected precision under specific test conditions. It’s important to remember, as a general principle of thermography (not specific to this device’s capabilities), that real-world measurement accuracy can also be influenced by factors such as the distance to the target, atmospheric conditions, and crucially, the emissivity of the surface being measured. Emissivity is a property that describes how efficiently a material radiates thermal energy compared to a perfect blackbody – different materials (like polished metal vs. matte paint) radiate differently even at the same temperature. While the HURRICANE’s specifications don’t mention emissivity adjustments, understanding its stated accuracy range provides a baseline for interpreting the temperature readings it displays.
Reading the Heat Signature: Practical Insights from Thermal Vision
The true power of thermal imaging lies in its application – using this “heat vision” to gain insights and diagnose problems that would otherwise remain hidden. By revealing temperature anomalies, a thermal camera acts like a non-contact probe, allowing you to “see” potential issues based on fundamental thermal principles. The source material suggests several applications where this can be invaluable:
- Troubleshooting Hot and Cold Spots for Energy Efficiency: Walls, windows, attics, and ductwork should ideally maintain relatively uniform temperatures if properly insulated and sealed. A thermal imager can instantly reveal inconsistencies: cold spots indicating missing insulation or air leaks (where unwanted heat transfer via convection or conduction is occurring), or hot spots perhaps indicating overloaded wiring within a wall (resistive heating). This allows for targeted fixes to save energy and improve comfort.
- Electrical System Maintenance (e.g., Transformer Rooms): Electrical resistance generates heat (I²R heating). Faulty connections, corroded contacts, overloaded circuits, or failing components often run significantly hotter than properly functioning ones. A thermal scan can quickly pinpoint these overheating areas before they lead to catastrophic failure or fire hazards, forming a cornerstone of preventative maintenance in many industries.
- Automotive Diagnostics: Engines, exhausts, radiators, bearings, and brakes all operate within specific thermal ranges. Deviations can indicate problems. An unusually hot spot on an engine block might suggest a cooling system issue. An exhaust manifold glowing unevenly could point to a cylinder misfire. Overheating bearings generate excess friction, visible as heat. Thermal imaging provides a quick, non-contact way to survey these systems.
- HVAC Repair: Air conditioning and heating systems rely on temperature differentials. A thermal camera can help visualize airflow, locate refrigerant leaks (which often cause localized cooling), identify blocked vents, or check the performance of heating elements and compressors.
In essence, thermal imaging allows you to see the physical processes of heat transfer, friction, and electrical resistance at work, turning temperature patterns into actionable diagnostic clues.
The Thermographer’s Tool: Design for Use
For any diagnostic tool, practicality is key. The HURRICANE Thermal Imaging Camera is designed as a handheld, portable unit. The description mentions a “sure grip ergonomic handle,” suggesting an emphasis on comfortable use during inspections. Its power source is straightforward: four standard AAA batteries, which are noted as being included, allowing for immediate use and easy replacement.
Capturing findings is crucial for documentation and analysis. The camera reportedly includes a BONUS 4 GB built-in memory card to store the thermal images you capture. This allows you to save snapshots of problematic areas or document conditions before and after repairs. An included Mini USB cable presumably facilitates transferring these images from the camera to a computer for reporting or further examination, making it convenient to manage the collected data.
For protection during transport and storage, a travel pouch is also listed as part of the package. The technical details specify the outer material as “Iron,” contributing to its listed weight of 15.8 ounces, though this material choice is somewhat unusual for modern handheld electronics housings which more commonly use durable polymers.
A New Dimension of Perception
The world is constantly radiating a story told in the language of heat, a story invisible to our unaided eyes. Thermal imaging technology acts as our translator, converting the subtle emissions of infrared energy into vivid images that reveal temperature differences with remarkable clarity. Handheld devices like the HURRICANE Thermal Imaging Camera, operating based on the specifications provided, offer an accessible way to tap into this hidden dimension.
By understanding the basic principles of infrared science and how features like resolution, color palettes, and temperature range relate to visualizing and quantifying heat, we can leverage such tools effectively. Whether used for identifying energy waste in our homes, performing preventative maintenance on critical equipment, or diagnosing elusive automotive issues, thermal imaging empowers us. It grants us a form of enhanced perception, allowing us to see beyond the surface and make more informed decisions based on the fundamental thermal realities of the world around us. It’s less about the gadget itself, and more about the powerful insight gained when we learn to truly see the invisible.